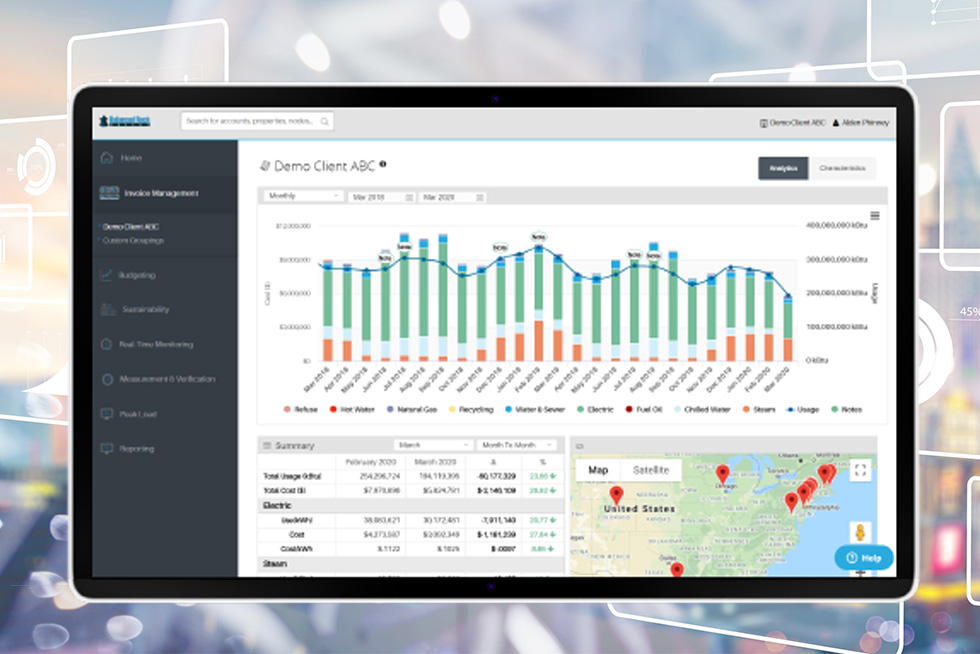
Our energy analytics solution allows you to budget and forecast based on actual consumption.
Our fully automated energy data analytics platform allows for direct data capture via Utility RPA and Interval Meter Capture. Your organization will receive your own energy and sustainability dashboard. Using our data analytics platform, we’ll be able to work with you to budget and forecast your energy usage and ensure peak load management. The sustainability dashboard integrates with Energy Star, LEED Arc, GRESB and Energy to Care. With full energy data analytics reporting, we’ll provide you with the key facts and figures you need to make the most informed decisions possible around your energy usage.
We will develop a customized data analytics solution specific to your needs.
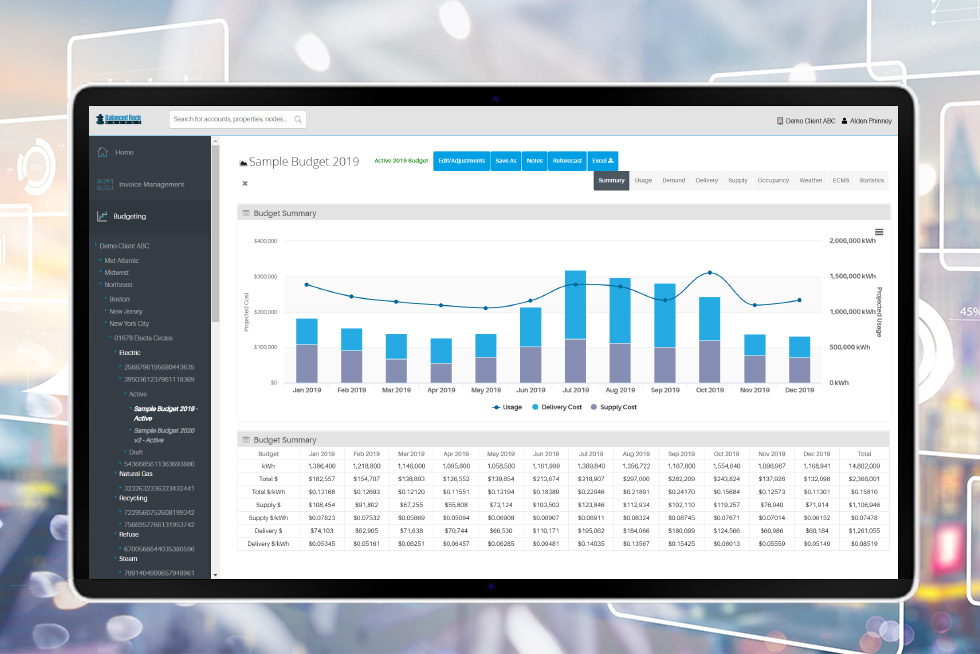
Utility Budgeting
Allows you to budget based on actual consumption. You’ll be able to understand the impact of business activity, occupancy, weather and efficiency projects on your total energy consumption and costs. Data analytics for utility budgeting allows you to allocate capital efficiently.
Allows you to budget based on actual consumption. You’ll be able to understand the impact of business activity, occupancy, weather and efficiency projects on your total energy consumption and costs. Data analytics for utility budgeting allows you to allocate capital efficiently.
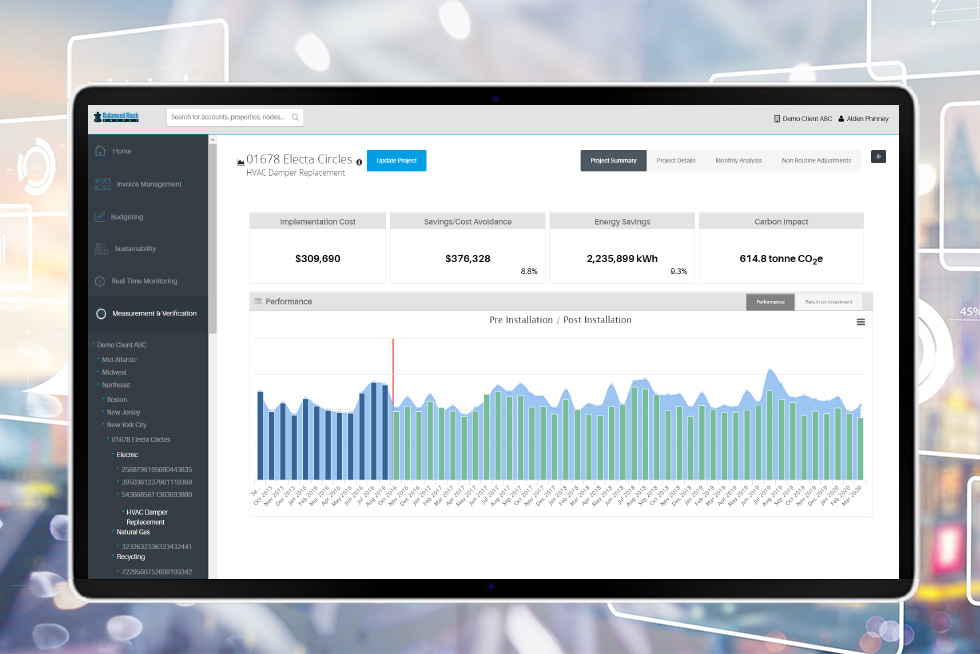
Measurement and Verification
Measurement and verification analytics allow you to track multiple ECMs. You can normalize for weather, billing period length, occupancy and more. You’ll even be able to verify performance and clearly track your ROI.
Measurement and verification analytics allow you to track multiple ECMs. You can normalize for weather, billing period length, occupancy and more. You’ll even be able to verify performance and clearly track your ROI.
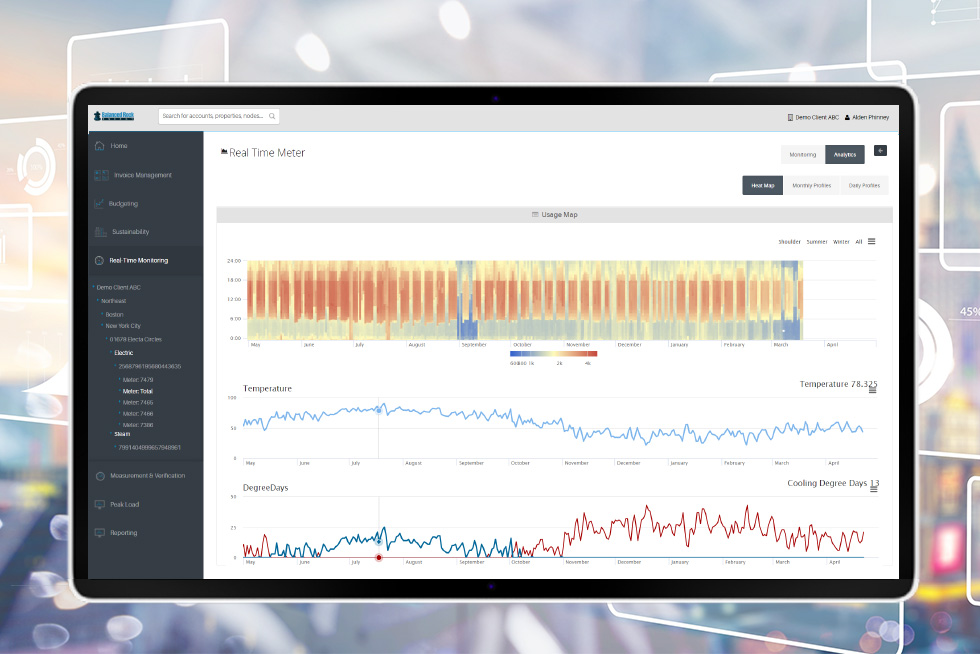
Real-Time Monitoring and Analytics
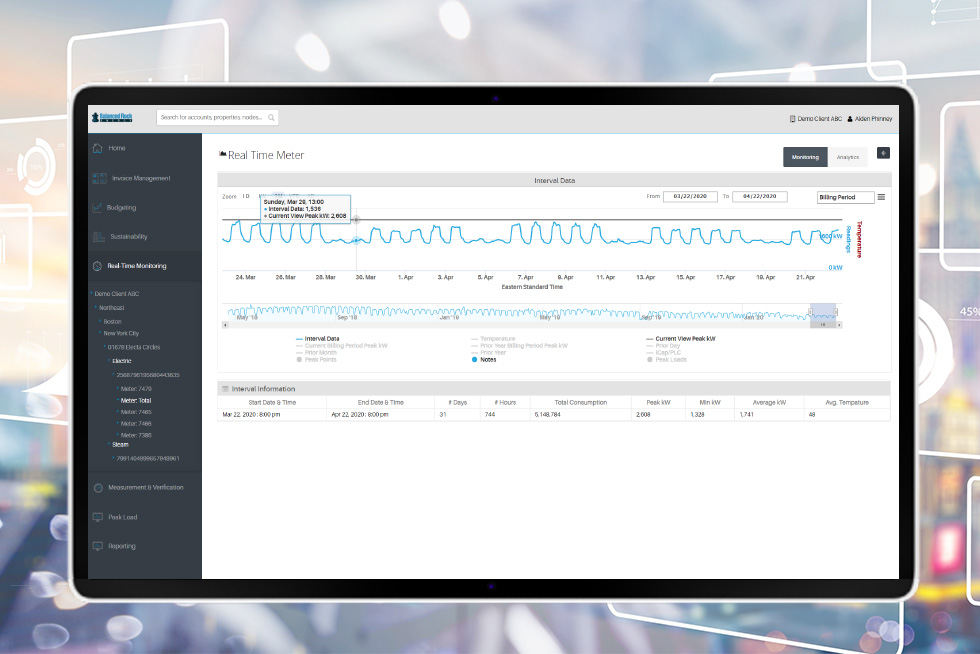
Your dashboard will be updated in 5 second to 60 minute intervals. You can set consumption and peak alerts via email and text message. As well as user defined threshold alerts and system generated alerts based on prior peak usage. View real-time data against any prior day, month, year or peak kW.
Your dashboard will be updated in 5 second to 60 minute intervals. You can set consumption and peak alerts via email and text message. As well as user defined threshold alerts and system generated alerts based on prior peak usage. View real-time data against any prior day, month, year or peak kW.
Threshold and User Defined Alerts
Receive alerts when demand is within a defined percentage threshold vs. current billing period peak, prior peak, same month prior year or a user defined value. Create notes on charts to identify operational activities.
Receive alerts when demand is within a defined percentage threshold vs. current billing period peak, prior peak, same month prior year or a user defined value. Create notes on charts to identify operational activities.
ICAP Peak Load Notifications
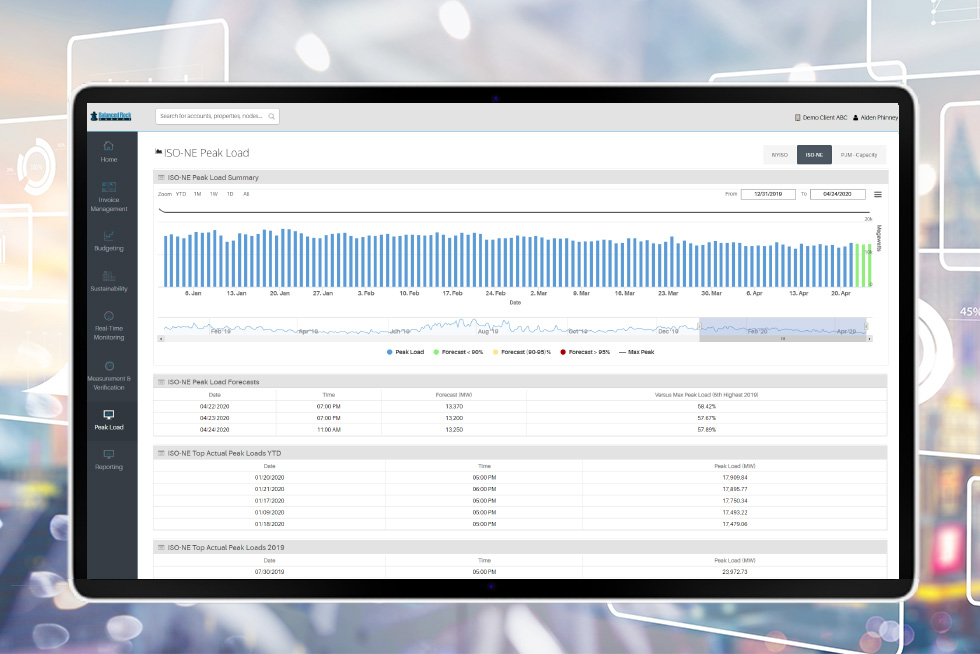
Receive email/text message notifications when the grid is expected to peak. Track when actual peak loads occurred. Reduce capacity and peak demand charges by tens of thousands of dollars per month.
Receive email/text message notifications when the grid is expected to peak. Track when actual peak loads occurred. Reduce capacity and peak demand charges by tens of thousands of dollars per month.
ENERGY STAR Portfolio Manager
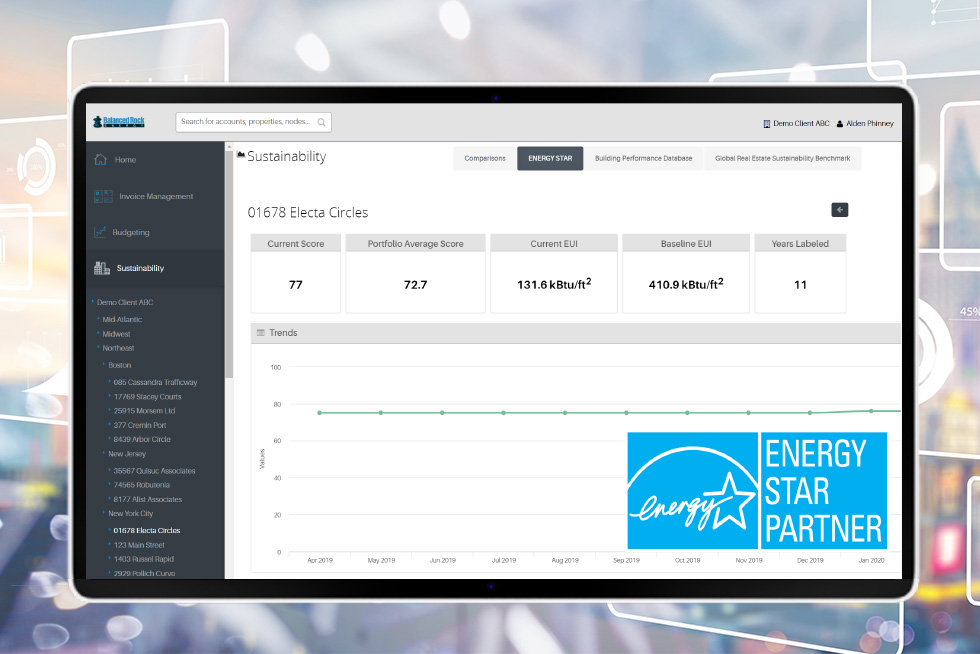
Direct API integration with Portfolio Manager’s platform. No need to manually update or upload csv files. Additional sustainability reporting APIs are available for LEED Arc, GRESB and Energy to Care.
Direct API integration with Portfolio Manager’s platform. No need to manually update or upload csv files. Additional sustainability reporting APIs are available for LEED Arc, GRESB and Energy to Care.
